numpy.random.RandomState.logseries#
method
- random.RandomState.logseries(p, size=None)#
从对数级数分布中抽取样本.
样本是从具有指定形状参数的对数级数分布中抽取的,0 <=
p< 1.- 参数:
- pfloat 或 float 的类数组
分布的形状参数.必须在范围 [0, 1) 内.
- sizeint 或 int 元组,可选
输出形状.如果给定的形状是,例如,
(m, n, k),那么将抽取m * n * k个样本.如果 size 是None(默认值),如果 p 是标量,则返回单个值.否则,将抽取np.array(p).size个样本.
- 返回:
- outndarray 或标量
从参数化对数级数分布中抽取的样本.
参见
scipy.stats.logser概率密度函数,分布或累积密度函数等.
random.Generator.logseries新代码应该使用它.
注释
对数级数分布的概率密度为
\[P(k) = \frac{-p^k}{k \ln(1-p)},\]其中 p = 概率.
对数级数分布经常用于表示物种丰富度和出现率,最初由 Fisher,Corbet 和 Williams 在 1943 年提出 [2].它还可以用于模拟汽车中看到的乘员人数 [3].
参考文献
[1]Buzas, Martin A.; Culver, Stephen J., 通过发生的对数级数分布理解区域物种多样性:生物多样性研究 多样性与分布,第 5 卷,第 5 期,1999 年 9 月,第 187-195(9) 页.
[2]Fisher, R.A,, A.S. Corbet, and C.B. Williams. 1943. 动物种群随机样本中物种数量与个体数量之间的关系.动物生态学杂志,12:42-58.
[3]D. J. Hand, F. Daly, D. Lunn, E. Ostrowski, A Handbook of Small Data Sets, CRC Press, 1994.
[4]维基百科,"对数分布",https://en.wikipedia.org/wiki/Logarithmic_distribution
示例
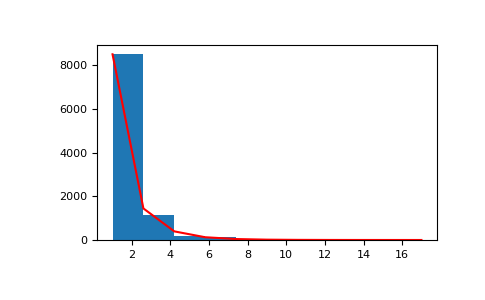
从分布中抽取样本:
>>> a = .6
>>> s = np.random.logseries(a, 10000)
>>> import matplotlib.pyplot as plt
>>> count, bins, ignored = plt.hist(s)
# 针对分布绘图
>>> def logseries(k, p):
...     return -p**k/(k*np.log(1-p))
>>> plt.plot(bins, logseries(bins, a)*count.max()/
...          logseries(bins, a).max(), 'r')
>>> plt.show()