numpy.random.noncentral_chisquare#
- random.noncentral_chisquare(df, nonc, size=None)#
从非中心卡方分布中抽取样本.
非中心 \(\chi^2\) 分布是 \(\chi^2\) 分布的推广.
备注
新代码应该使用
noncentral_chisquare方法,该方法属于Generator实例;请参考 快速入门 .- 参数:
- dffloat 或 float 的类数组
自由度,必须 > 0.
- noncfloat 或 float 的类数组
非中心性,必须是非负的.
- sizeint 或 int 元组,可选
输出形状.如果给定的形状是,例如
(m, n, k),则抽取m * n * k个样本.如果 size 是None(默认),则如果df和nonc都是标量,则返回单个值.否则,抽取np.broadcast(df, nonc).size个样本.
- 返回:
- outndarray 或标量
从参数化的非中心卡方分布中抽取的样本.
参见
注释
非中心卡方分布的概率密度函数为
\[P(x;df,nonc) = \sum^{\infty}_{i=0} \frac{e^{-nonc/2}(nonc/2)^{i}}{i!} P_{Y_{df+2i}}(x),\]其中 \(Y_{q}\) 是具有 q 个自由度的卡方分布.
参考文献
[1]Wikipedia, “Noncentral chi-squared distribution” https://en.wikipedia.org/wiki/Noncentral_chi-squared_distribution
示例
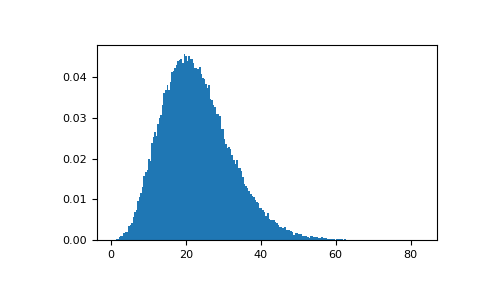
从分布中绘制值并绘制直方图
>>> import matplotlib.pyplot as plt
>>> values = plt.hist(np.random.noncentral_chisquare(3, 20, 100000),
...                   bins=200, density=True)
>>> plt.show()

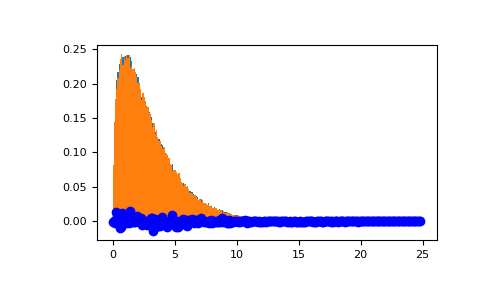
从具有非常小的非中心性的非中心卡方中绘制值,并与卡方进行比较.
>>> plt.figure()
>>> values = plt.hist(np.random.noncentral_chisquare(3, .0000001, 100000),
...                   bins=np.arange(0., 25, .1), density=True)
>>> values2 = plt.hist(np.random.chisquare(3, 100000),
...                    bins=np.arange(0., 25, .1), density=True)
>>> plt.plot(values[1][0:-1], values[0]-values2[0], 'ob')
>>> plt.show()
演示非中心性的较大值如何导致更对称的分布.
>>> plt.figure()
>>> values = plt.hist(np.random.noncentral_chisquare(3, 20, 100000),
...                   bins=200, density=True)
>>> plt.show()