numpy.random.standard_gamma#
- random.standard_gamma(shape, size=None)#
从标准 Gamma 分布中抽取样本.
样本是从具有指定参数,形状(有时指定为"k")和 scale=1 的 Gamma 分布中抽取的.
备注
新代码应该使用
standard_gamma方法,该方法是Generator实例的一部分;请参阅 快速入门 .- 参数:
- shapefloat 或 float 的类数组
参数,必须是非负数.
- sizeint 或 int 元组,可选
输出形状.如果给定的形状是,例如,
(m, n, k),则抽取m * n * k个样本.如果 size 为None(默认值),则如果shape是标量,则返回单个值.否则,将抽取np.array(shape).size个样本.
- 返回:
- outndarray 或标量
从参数化的标准伽马分布中抽取样本.
参见
scipy.stats.gamma概率密度函数,分布或累积密度函数等.
random.Generator.standard_gamma新代码应该使用它.
注释
伽马分布的概率密度为
\[p(x) = x^{k-1}\frac{e^{-x/\theta}}{\theta^k\Gamma(k)},\]其中 \(k\) 是形状, \(\theta\) 是尺度, \(\Gamma\) 是伽马函数.
伽马分布通常用于对电子元件的故障时间进行建模,并且自然地出现在泊松分布事件之间的等待时间相关的过程中.
参考文献
[1]Weisstein, Eric W. “伽马分布.” 来自 MathWorld–一个 Wolfram 网络资源. https://mathworld.wolfram.com/GammaDistribution.html
[2]维基百科,"伽马分布",https://en.wikipedia.org/wiki/Gamma_distribution
示例
从分布中抽取样本:
>>> shape, scale = 2., 1. # mean and width
>>> s = np.random.standard_gamma(shape, 1000000)
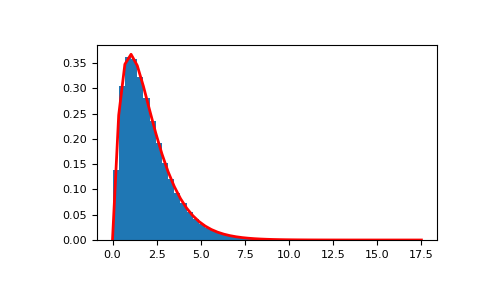
显示样本的直方图,以及概率密度函数:
>>> import matplotlib.pyplot as plt
>>> import scipy.special as sps
>>> count, bins, ignored = plt.hist(s, 50, density=True)
>>> y = bins**(shape-1) * ((np.exp(-bins/scale))/
...                       (sps.gamma(shape) * scale**shape))
>>> plt.plot(bins, y, linewidth=2, color='r')
>>> plt.show()