numpy.random.Generator.logistic#
method
- random.Generator.logistic(loc=0.0, scale=1.0, size=None)#
从逻辑分布中抽取样本.
样本是从具有指定参数的逻辑分布中抽取的,loc(位置或均值,也称为中位数)和 scale (>0).
- 参数:
- loc浮点数或浮点数数组,可选
分布的参数.默认为 0.
- scale浮点数或浮点数数组,可选
分布的参数.必须是非负数.默认为 1.
- sizeint 或 int 元组,可选
输出形状.如果给定的形状是例如
(m, n, k),则抽取m * n * k个样本.如果 size 为None(默认),则如果loc和scale都是标量,则返回单个值.否则,将抽取np.broadcast(loc, scale).size个样本.
- 返回:
- outndarray 或标量
从参数化逻辑分布中抽取的样本.
参见
scipy.stats.logistic概率密度函数,分布或累积密度函数等.
注释
Logistic 分布的概率密度为
\[P(x) = \frac{e^{-(x-\mu)/s}}{s(1+e^{-(x-\mu)/s})^2},\]其中 \(\mu\) = 位置, \(s\) = 尺度.
Logistic 分布用于极值问题,在这些问题中,它可以充当 Gumbel 分布的混合,用于流行病学,以及世界国际象棋联合会 (FIDE),它用于 Elo 排名系统,假设每个玩家的表现是一个逻辑分布的随机变量.
参考文献
[1]Reiss, R.-D. and Thomas M. (2001), “Statistical Analysis of Extreme Values, from Insurance, Finance, Hydrology and Other Fields,” Birkhauser Verlag, Basel, pp 132-133.
[2]Weisstein, Eric W. “Logistic Distribution.” From MathWorld–A Wolfram Web Resource. https://mathworld.wolfram.com/LogisticDistribution.html
[3]Wikipedia, “Logistic-distribution”, https://en.wikipedia.org/wiki/Logistic_distribution
示例
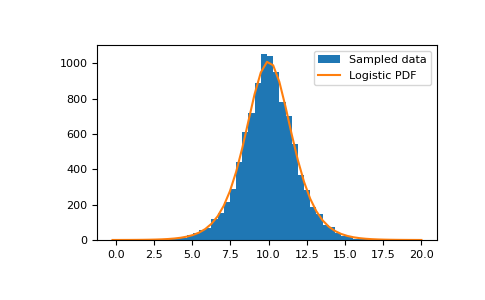
从分布中抽取样本:
>>> loc, scale = 10, 1
>>> rng = np.random.default_rng()
>>> s = rng.logistic(loc, scale, 10000)
>>> import matplotlib.pyplot as plt
>>> count, bins, _ = plt.hist(s, bins=50, label='Sampled data')
# 根据精确分布绘制采样数据
>>> def logistic(x, loc, scale):
...     return np.exp((loc-x)/scale)/(scale*(1+np.exp((loc-x)/scale))**2)
>>> logistic_values  = logistic(bins, loc, scale)
>>> bin_spacing = np.mean(np.diff(bins))
>>> plt.plot(bins, logistic_values  * bin_spacing * s.size, label='Logistic PDF')
>>> plt.legend()
>>> plt.show()